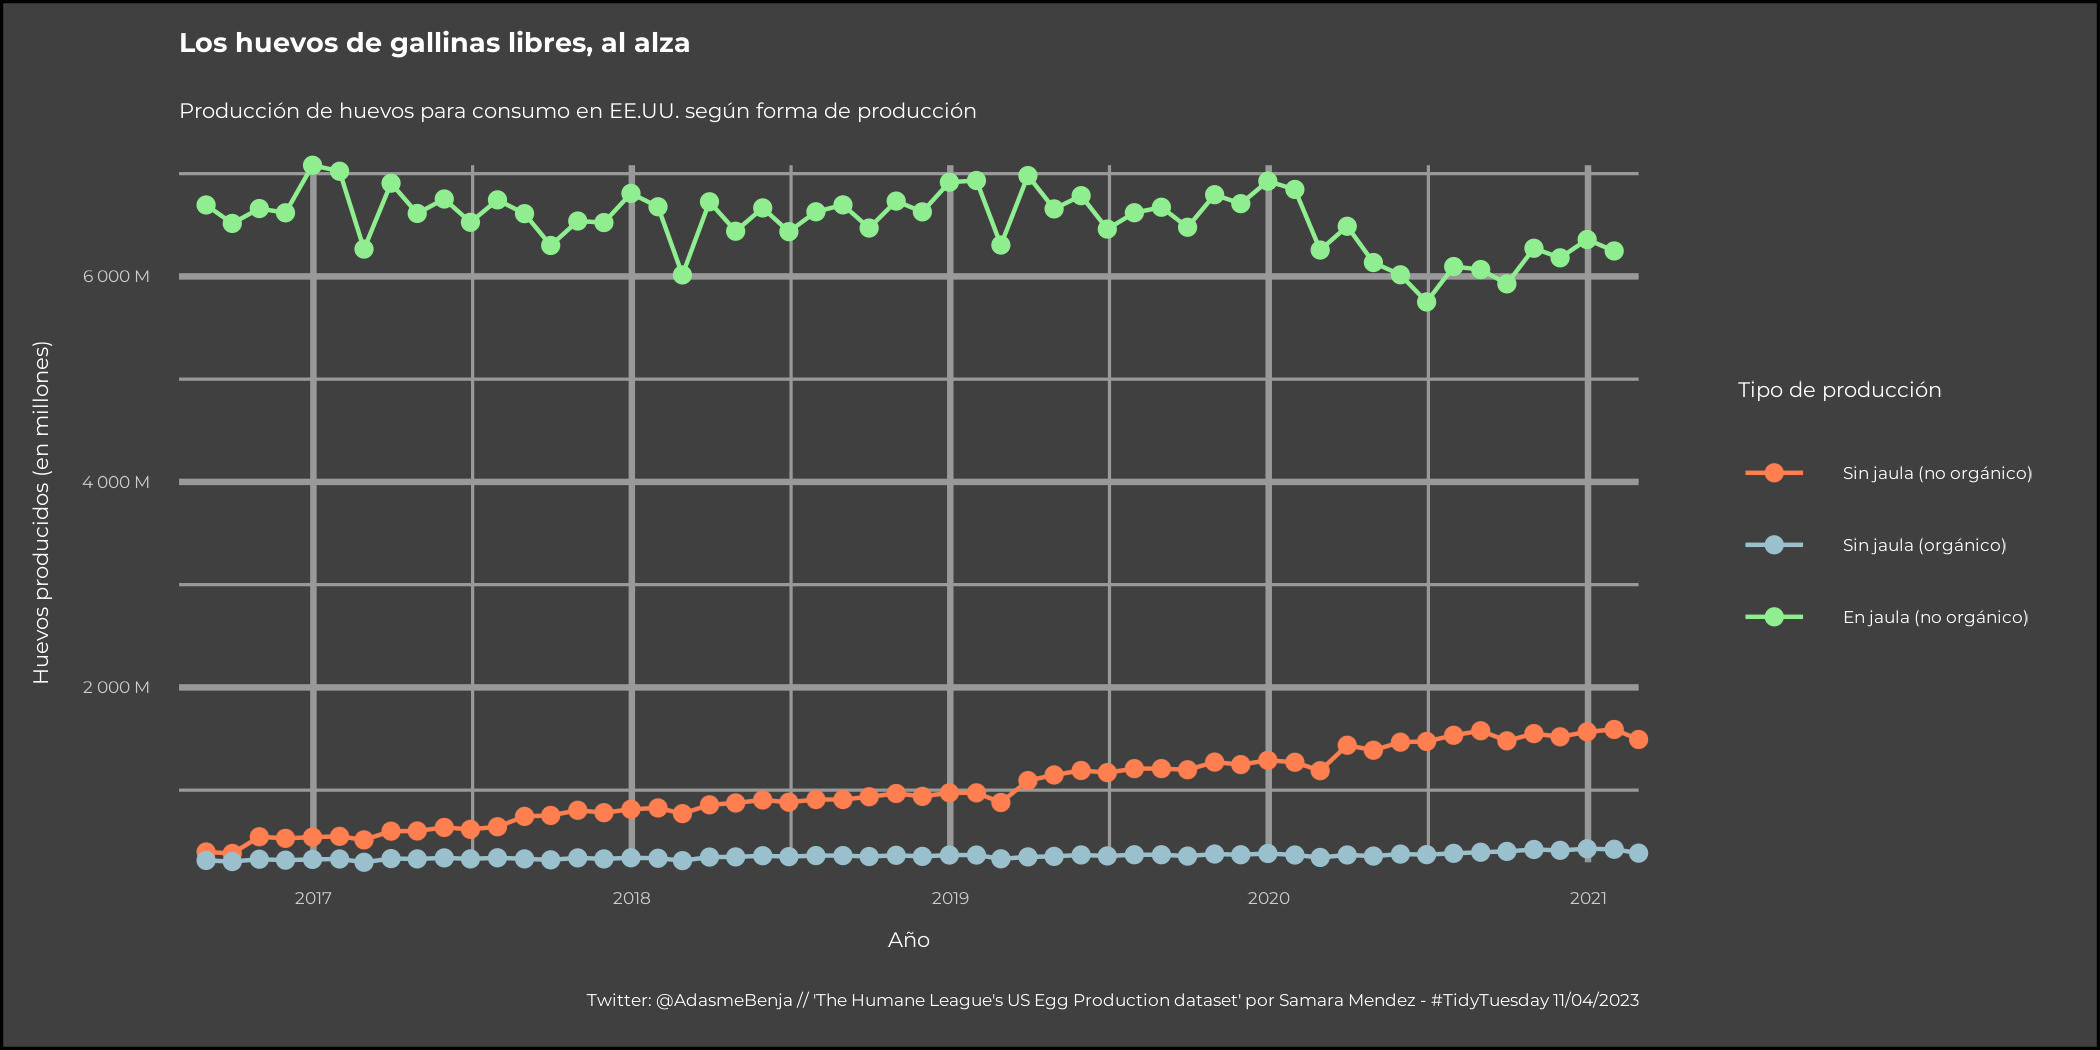
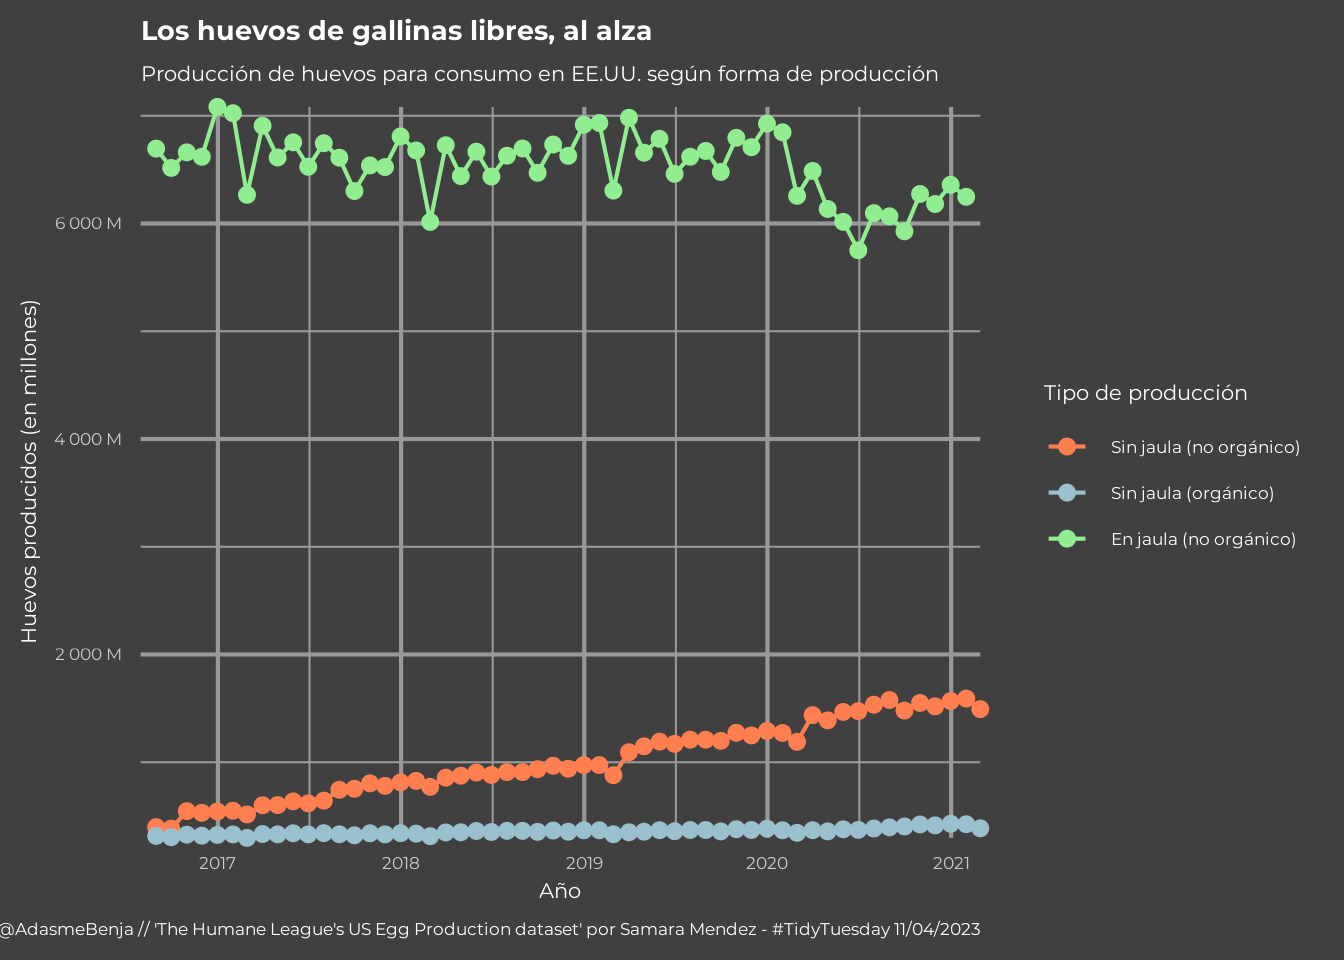
El martes 11 de abril de 2023 Tidy Tuesday publicó los datos sobre producción de huevos en Estados Unidos (enlace) . Con estos datos exploramos la producción de huevos de “gallinas libres”, aquellas que se crían fuera de jaulas, siguiendo los métodos tradicionales pre-industrialización.
Resultado
Código
Cargamos las librerías y los datos
:: p_load (tidyverse,<- tt_load ("2023-04-11" )
---- Compiling #TidyTuesday Information for 2023-04-11 ----
--- There are 2 files available ---


── Downloading files ───────────────────────────────────────────────────────────

  1 of 2: "egg-production.csv"
  2 of 2: "cage-free-percentages.csv"
#tidytuesdayR::readme(data_15) <- data_15$ ` egg-production ` <- data_15$ ` cage-free-percentages ` head (egg_prod)
# A tibble: 6 × 6
  observed_month prod_type     prod_process   n_hens     n_eggs source
  <date>         <chr>         <chr>           <dbl>      <dbl> <chr>
1 2016-07-31     hatching eggs all          57975000 1147000000 ChicEggs-09-23-…
2 2016-08-31     hatching eggs all          57595000 1142700000 ChicEggs-10-21-…
3 2016-09-30     hatching eggs all          57161000 1093300000 ChicEggs-11-22-…
4 2016-10-31     hatching eggs all          56857000 1126700000 ChicEggs-12-23-…
5 2016-11-30     hatching eggs all          57116000 1096600000 ChicEggs-01-24-…
6 2016-12-31     hatching eggs all          57750000 1132900000 ChicEggs-02-28-…
Cargamos las fuentes desde Google
font_add_google ("Montserrat" , "mont" )showtext_auto ()
Cambiamos los datos al formato “long” y calculamos la cantidad de huevos de criaderos regulares restado al total aquellos que provienen de gallinas libres.
<- egg_prod %>% filter (prod_type == "table eggs" ) %>% pivot_wider (id_cols = observed_month,names_from = prod_process,values_from = n_eggs) %>% rowwise () %>% mutate (regular_egg = all - (` cage-free (non-organic) ` + ` cage-free (organic) ` )) %>% select (- all) %>% pivot_longer (cols = 2 : 4 ,names_to = "prod_process" ,values_to = "n_eggs" )head (data_mod)
# A tibble: 6 × 3
  observed_month prod_process                 n_eggs
  <date>         <chr>                         <dbl>
1 2016-07-31     cage-free (non-organic)         NA
2 2016-07-31     cage-free (organic)             NA
3 2016-07-31     regular_egg                     NA
4 2016-08-31     cage-free (non-organic)  397884291.
5 2016-08-31     cage-free (organic)      315968297.
6 2016-08-31     regular_egg             6695147411.
Con los datos preparados, creamos el gráfico que compara la producción en jaula y sin jaula (orgánicos y no orgánicos)
%>% ggplot (aes (observed_month, n_eggs, group = prod_process, color = prod_process)) + geom_line () + geom_point () + # geom_smooth(show.legend = F) scale_color_manual (values = c ("coral" , "lightblue3" , "lightgreen" ),labels = c ("Sin jaula (no orgánico)" , "Sin jaula (orgánico)" , "En jaula (no orgánico)" ),name = "Tipo de producción" ) + scale_y_continuous (labels = scales:: label_number (scale = 0.000001 , suffix = " M" )) + labs (title = "Los huevos de gallinas libres, al alza" ,subtitle = "Producción de huevos para consumo en EE.UU. según forma de producción" ,x = "Año" ,y = "Huevos producidos (en millones)" ,caption = "Twitter: @AdasmeBenja // 'The Humane League's US Egg Production dataset' por Samara Mendez - #TidyTuesday 11/04/2023" ) + coord_cartesian (expand = F, clip = "off" ) + theme_minimal (base_size = 16 , base_family = "mont" ) + theme (text = element_text (color = "white" ), axis.text = element_text (color = "gray80" ),plot.background = element_rect (fill = "gray25" ), panel.grid = element_line (colour = "gray60" ),plot.title = element_text (face = "bold" , size = 20 )# , # legend.position = "bottom", # legend.direction = "horizontal"
Warning: Removed 4 rows containing missing values or values outside the scale range
(`geom_line()`).
Warning: Removed 4 rows containing missing values or values outside the scale range
(`geom_point()`).
Guardamos el gráfico para compartir como imagen
ggsave ("2023-w15-egg1.jpg" ,plot = last_plot (),width = 7 ,height = 3.5